Blog
Why Not All Normal Distributions Are Normal: Describing Uncertainty In Hydrocarbon Exploration

Researchers have measured the heights of a lot of women in USA, and plotted out the results as a probability distribution:
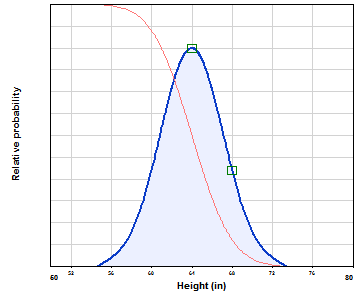
This is a bell-shaped (“normal” or “Gaussian”) distribution, with a mean of 5’ 4” and a standard deviation of about 3”.

(Few people really understand what a standard distribution means; the rest of us find it more useful to describe the variation of heights in a different way – using P values. A distribution’s P value Pxx is that value which has an xx chance of being exceeded. So, if you meet a woman at random in USA, the graph above says that there is a 90% chance that she will be 5’ or taller, and a 10% chance that she will be 5’ 8” or taller.)
The normal distribution is a good description of peoples’ height, but it’s not perfect. It has been noted that there are more very short women and more very tall women than the normal distribution predicts. One reason for this is that the “all US women” distribution is actually a combination of lots of different underlying distributions, corresponding – amongst other things – to ethnic groups, dietary habits, rare genetic conditions, and so on. Each one is normal, or nearly so; when you put them all together it still looks nearly normal. But if you go to the North mid-West of the USA, where much of the population is of Scandinavian descent and follow healthy diets, the above graph could be very misleading.
This shows that if there is a lot of data to work with, it’s easy to make generalisations; but when you think a bit harder about it, you may find that generalisations mask more relevant truths.
This matters in hydrocarbon exploration because there is so much uncertainty involved – and, very often, the underlying assumptions (for example, the geological model) should itself be questioned.
If, in the last century, you plotted the porosity distribution of oil-producing sandstone reservoirs in USA, you could probably have fitted a normal distribution – it may have been slightly skewed to the right, but not by too much. If you plot this distribution today, the new shale oil reservoirs would distort the results beyond any comfort zone. There is a new model for porosity in oil production, and you shouldn’t cram it into the old one.
Advanced oil and gas software such as REP has a mind for anomalies and calculates prospects based on tangible results. To request a free demo of REP, please click here. Alternatively, email support@logicomep.com to find out more.