Blog
Danger Spreadsheets Incoming

Danger: Spreadsheets Incoming.
People love spreadsheets, for the excellent reasons that they work and are easy to use. As long as there aren’t too many equations and macros anybody can pick one up and see what’s going on. Compare that to the software black holes that so many technical staff like or are obliged to use.
And if you are making lists of things a spreadsheet is especially brilliant, because everything is so clear. And if the thing you are listing has a value or a measurement, how easy is it to work out all sorts of properties that measurement or value may give rise to.
It’s the world of statistics. And when people say that statistics are so boring, or always lie, it’s amazing how un-bored they become when that thing being listed has a real value to them.
It doesn’t have to be financial. Is your child the quickest sprinter in the class? Was your car the editor’s top pick?
But when money is involved interest – and especially self-interest – rises to new peaks. Who doesn’t note the movement of house prices, interest rates, the stock market..? You don’t have to be actively involved; but most of us are affected one way or another, and most of us therefore keep an eye on it, even if we pretend we don’t.
So now consider some company executives, bonuses at stake, looking at a list of their assets. And if these are oil company executives the assets they are looking at are oil and gas fields, discovered or potential.
With these assets comes uncertainty – just how big are they really? It’s not just geological uncertainty: there are engineering, commercial and political considerations. For that reason almost all serious players in the game consider a range of possible outcomes; low case, mid-case, high case; or more precisely P90, P50, P10 and mean. A P90 value is one which you think your asset has a 90% chance of being bigger than, so is a good and well defined measure of a low case. P10 will only be bettered 10% of the time. P50 is in the middle. The mean or average is also a middle value. Since it is common in the oil industry that estimates of volume are skewed towards the upside the mean is almost always bigger than the P50 – often substantially bigger. (By the way, this skew is not just because people are optimistic – it’s a consequence of the maths. Of course people are often optimistic too ..)
If you divide the P10 upside by the P90 downside you get a measure of the uncertainly in the volume you are looking at. For a new discovery this is typically around 3 – 5, but can be significantly more. That’s why you drill appraisal wells, to narrow down the uncertainty and make the decision to develop easier.
3 – 5 is quite a lot. Think of what it would mean if you were buying a house. You could be hoping you’ll get 4 bedrooms, but there’s a 10% chance you could get 2 or less and a 10% chance you could end up with 10 or more. And to find out what you are getting you’ve got to spend quite a lot of money which should reduce but probably won’t eliminate the uncertainty – and won’t change what’s there.
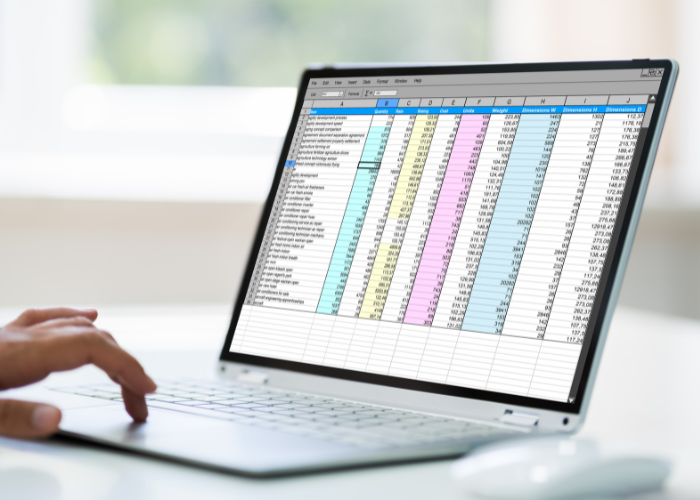
Back to those executives: mostly they’re not looking at just one asset, they have a list. Naturally, that list goes into a spreadsheet: names, volumes, costs, prices, income, value… There’s a lot that can go in, and in there too must be an indication of the uncertainty. Typically there will be P90, P50 P10 and mean columns for volumes and production. After this it can get a bit more complicated – upside and downside on price, on costs, on commercial uncertainties. Some companies will start with a “price per barrel” depending on how well established that barrel is, and where it is – discovered, developed, on/offshore, how stable politically the country is and so on. Others will be more rigorous. But they all start with that volume uncertainty.
Now here’s the incoming danger. Top right of Excel there’s a “∑” button. This lets you do a summation, and the temptation to add up the P90, P50, P10 and means columns so nicely listed in the spreadsheet is usually overwhelming.
It’s OK to add mean values, and adding P50’s, though wrong, is not normally a disaster. But if you add two P10’s the answer is a P1, or 1% chance of being exceeded. The same thing applies to P90’s, going the other way. You end up with a range of values for the summation which is far too wide. The more assets you have the wider the range.
It’s damaging at both ends. You think you’ve got a 10% chance of realising and upside you’ve got essentially no chance of getting, and a 10% chance of a downside which is incredibly unlikely. In short, you’ve opened yourself up to sleepless nights quite unnecessarily. And all because a spreadsheet makes it so easy.
Image source: Canva Photos


